MBS — Student Grade Tracker
MBS (Moyenne, Bilan, Stratégie) is a web app for Quebec secondary school students to track, analyze, and rank their grades. The tool has reached 130 active users, representing nearly 50% of the entire Secondary 5 grade level. It was my first project with a real collaborator — Howard — and the first time either of us used GitHub beyond reading code.
Working with someone at a different pace taught me how to manage a project. My collaborator Howard connected the Google Sheets backend and the projection tool. I built the rest: the data formatter, the grade calculator that handles complex weights, the leaderboard, and the user interface.
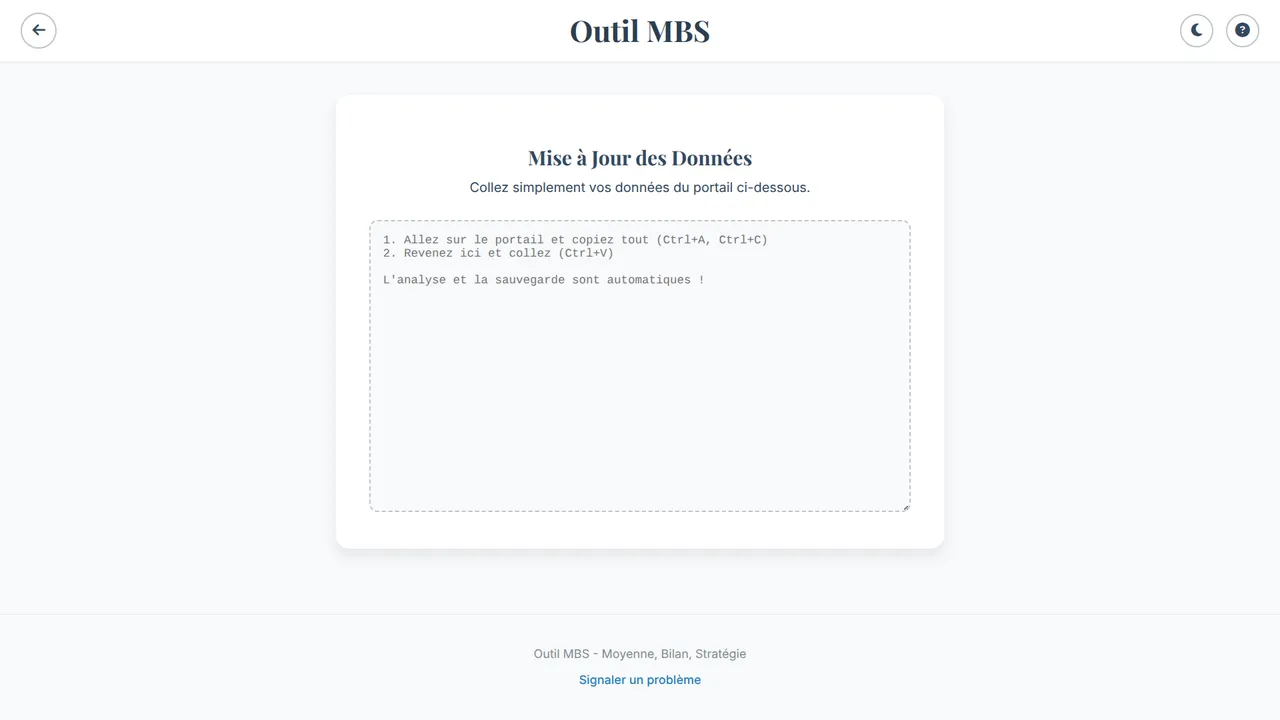
 The main page where students can paste their data from the school portal.
Data Ingestion
Students paste raw portal output into the data page. The formatter I wrote normalizes every grading format the Quebec system uses — letter grades (A+, B−), percentages, decimals, fractions — to a 0–100 scale before any calculation runs. Grades are then weighted by assessment type and term across Étapes 1–3 for both Secondaire 4 and 5.
Each parsed snapshot is timestamped and written to localStorage, so the dashboard tracks grade changes over time without requiring a login or a persistent server session.
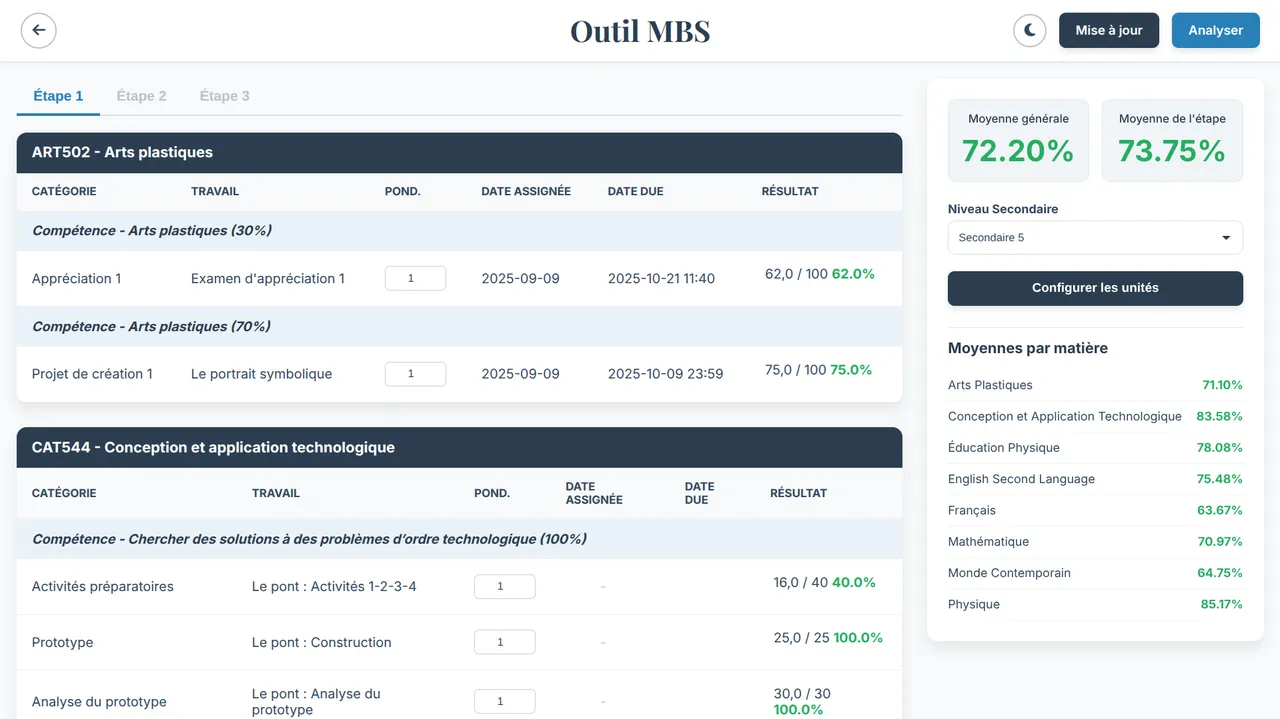
Average Calculator
The weighted average engine accounts for competency weights within each subject and term weights across the year. It mirrors the actual Quebec grading model rather than treating all grades equally — which is the main reason the numbers it produces match the official portal output.
Leaderboard & Rankings
Students who opt in share their mbsData object. The leaderboard filters to anyone with a global average ≥ 70 and computes rank and percentile:
percentile = (total − rank + 1) / total × 100
Rankings can be sorted by overall average or by subject. Color coding flags the top 10% and bottom 50% at a glance.
Grade Projections
Howard built the projection tool: given current grades and remaining assessments, it models the final average needed on each upcoming evaluation to hit a target. It runs on the same weighted calculation engine.
The Result
The tool is popular because it's fast and private. It processes all data locally in your browser so no one else sees your grades unless you choose to join the leaderboard. This project was a huge step in learning how to handle real user data and complex scoring systems.
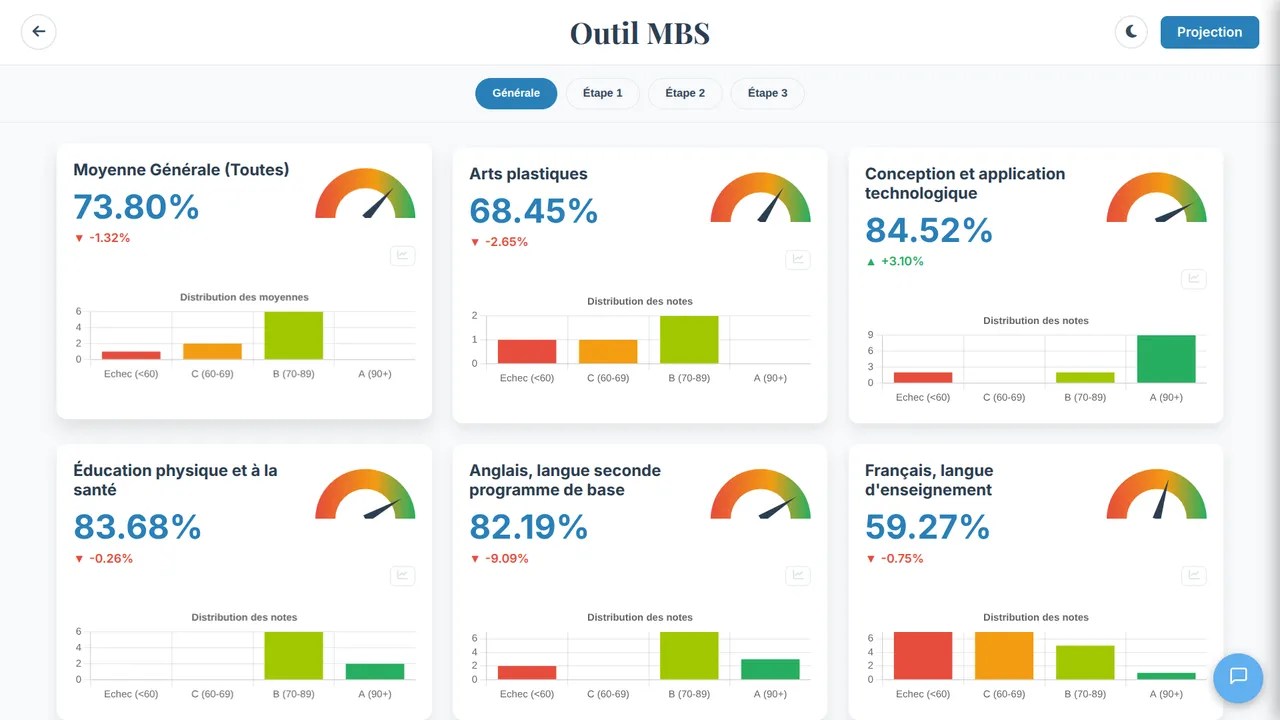 The statistics page shows your performance trends across different subjects.
Files & Links
Built at 16 years 8 months